
Guest Outreachy Team
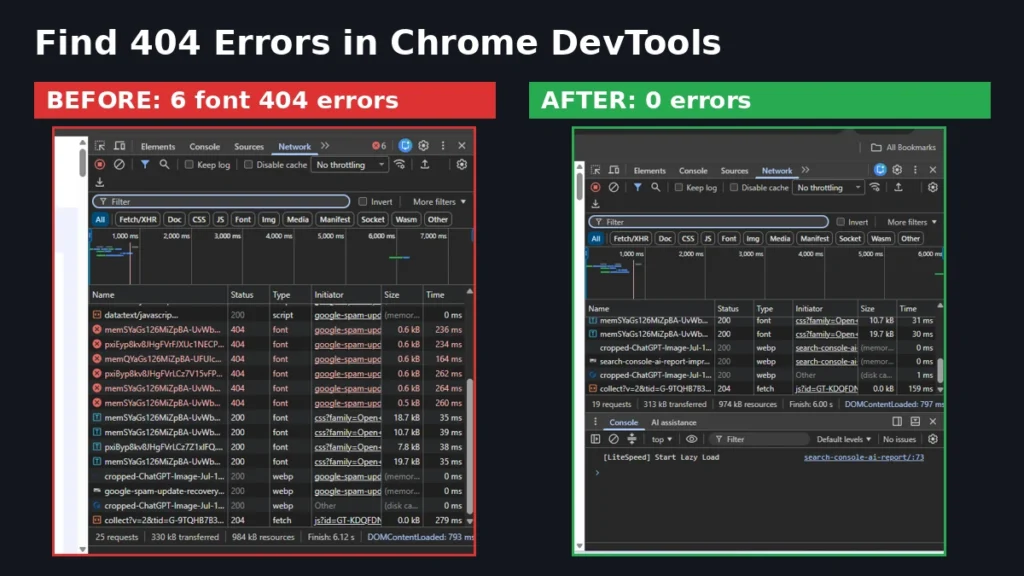
On October 22, 2026, our Search Console crawl report told us something was off. More than one in ten requests Googlebot made to guestoutreachy.com ended in an error. The pages looked fine. Nothing was broken on screen. So we opened the browser tools and went looking, and that is how we learned to find 404 errors in Chrome DevTools the hard way.
This post is the full story of that day, with the real screenshots we took along the way. You will see what Search Console showed us, how we tracked every broken request back to its cause, the two fixes that removed them and what changed afterwards. Nothing here is theory. It is what the Guest Outreachy team did, in the order we did it.
If Search Console is still new to you, our guide to the Search Console AI report shows another report worth checking. And if you want these problems caught before they pile up, our guide to website maintenance services explains what regular care looks like.
Table of Contents
It Started With Search Console
We were checking Settings, then Crawl stats in Search Console, a report most site owners never open. Two things stood out.
The first was speed. Search Console showed our server was slower to respond to Googlebot than we wanted.
The second was errors. In the breakdown by response, 83 percent of requests came back OK. But 11 percent were listed as Other client error (4XX), and another 4 percent were Not found (404).
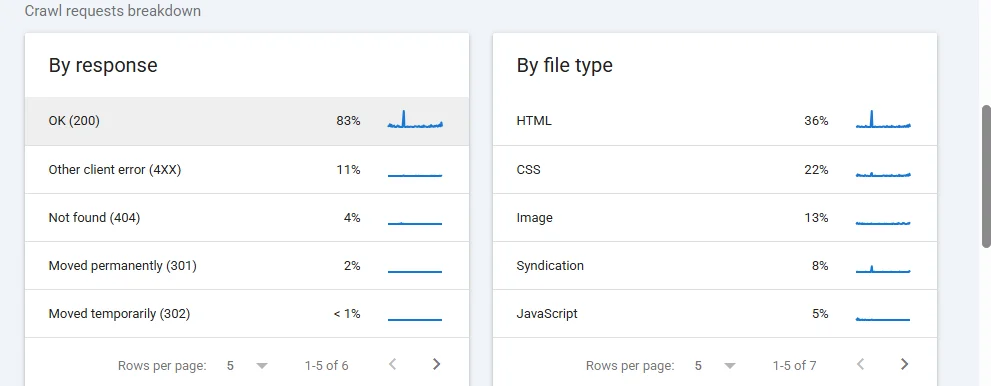
We clicked into the 4XX group to see which URLs were failing. Every single example was the same file, requested almost every day for weeks:
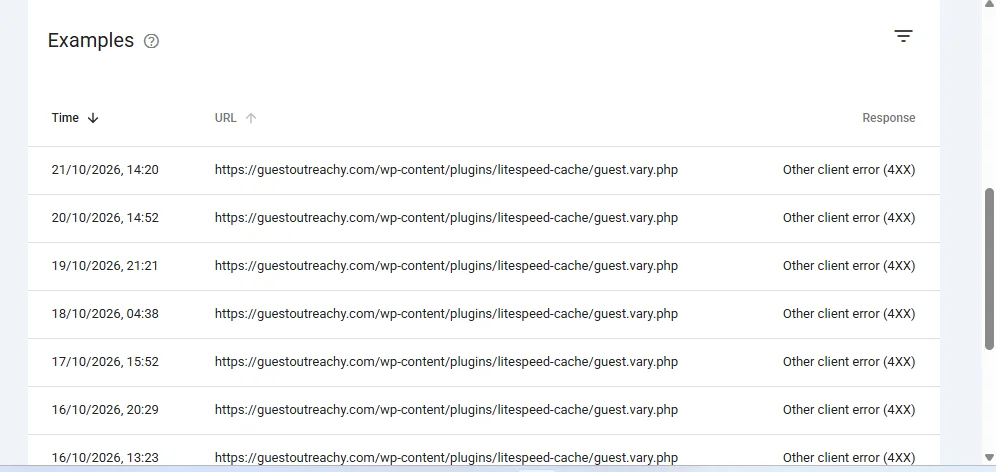
That file, guest.vary.php, lives inside the LiteSpeed Cache plugin. We had never linked to it. Googlebot was finding it anyway, and getting refused each time. We wanted to know what else our pages were asking for that we could not see.
Getting the Panel Open
The plan was simple: load a blog post with Chrome DevTools open and watch every file it requested.
The first try failed. On our laptop, F12 did nothing at all, because the key was set to control the screen brightness. If that happens to you, press Fn and F12 together, or use the shortcut that works on every Windows keyboard:
| What you want | Windows and Linux | Mac |
|---|---|---|
| Open DevTools | F12 or Ctrl + Shift + I | Command + Option + I |
| Open the Console | Ctrl + Shift + J | Command + Option + J |
| Inspect an element | Ctrl + Shift + C | Command + Shift + C |
These come from the official DevTools keyboard shortcuts page. You can also reach DevTools from the Chrome menu, under More tools, then Developer tools.
How to Find 404 Errors in Chrome DevTools
Here are the exact steps we followed. They work on any website, not only WordPress.
- Open the Network tab. It lists every file the page loads: the HTML, styles, scripts, fonts, images and background calls.
- Tick Disable cache. This makes Chrome download everything fresh, the way a first time visitor or Googlebot would. Skip this step and cached files can hide the problem from you.
- Reload the page with Ctrl + R, or Command + R on a Mac.
- Look for red rows. Failed requests stand out in red. You can also click the Status column to sort them together.
- Filter by code. Type
status-code:404in the Filter box to show only missing files. Try 403 and 500 as well. - Click a failed row. The Headers tab shows the full Request URL and the status code.
- Open the Initiator tab. This tells you which page, stylesheet or script asked for the file. That is your clue for where to fix it.
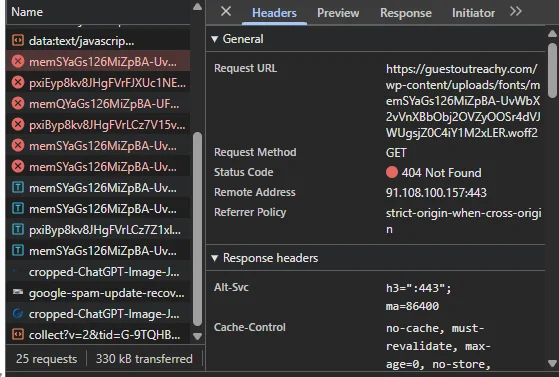
When we did this on one of our posts, the result was hard to miss. Out of 25 requests, six font files came back as 404, and guest.vary.php came back as 403:
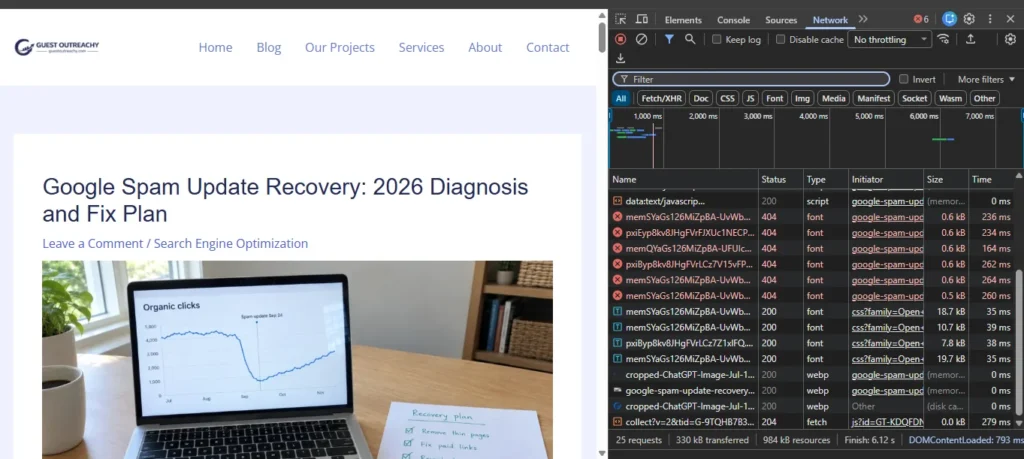
Clicking one of the red rows showed the full address. Every missing file sat in the same folder, wp-content/uploads/fonts, and every one returned 404 Not Found:
If you are not sure what a code means, this short table covers the ones you will see most:
| Code | What it means | Usual cause |
|---|---|---|
| 404 | Not Found | File deleted, renamed or never uploaded |
| 403 | Forbidden | A server or security rule blocks the file |
| 500 | Server error | A plugin or script crashed on the server |
| 301 or 302 | Redirect | File moved, fine unless redirects chain |
Google documents every column and filter in its Network features reference, including Preserve log for pages that redirect.
Tracing Each Broken File Back
Knowing a file is missing is only half the job. You need to know why the page keeps asking for it.
The Initiator tab pointed straight at the blog post itself. So the request was not coming from a plugin script. It was written into the page HTML.
To see that HTML, we pressed Ctrl + U, which opens the page source in a new tab. Then Ctrl + F and a search for uploads/fonts. There they were: a set of font rules for Inter and other families, telling every browser to download files from that folder.
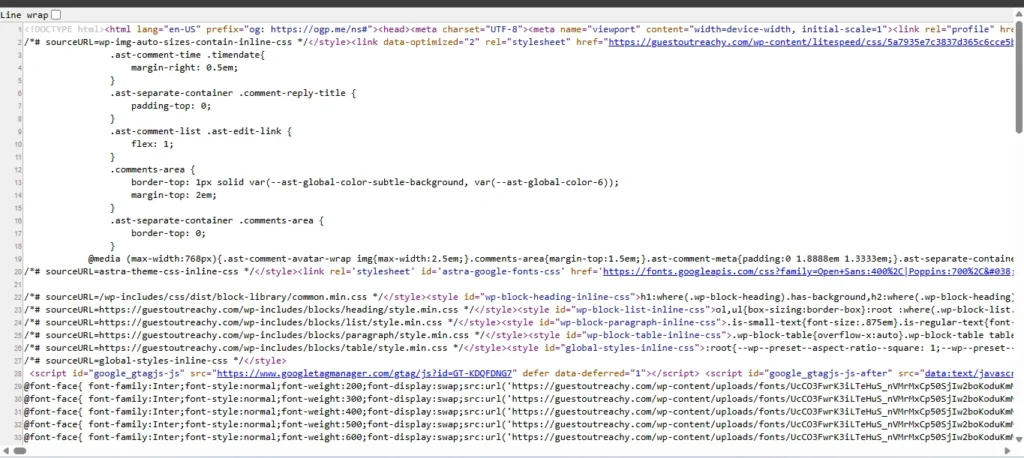
Next we opened the Hostinger File Manager and looked inside wp-content/uploads. There was no fonts folder at all. WordPress was sending visitors to files that did not exist.
The rules came from the WordPress Font Library. Three font families were still listed there, Inter, Open Sans and Poppins, and none of them was even active:
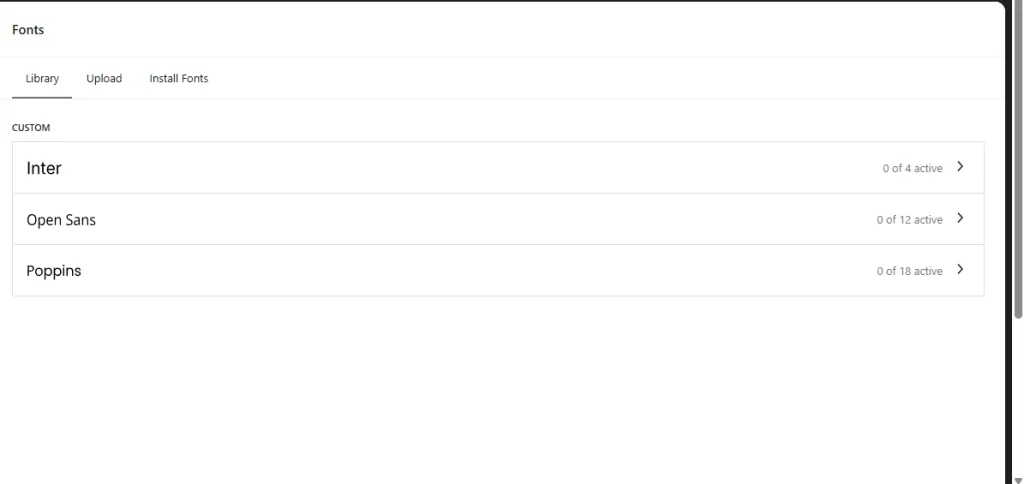
They were leftovers from an earlier design. Our Astra theme loads its own fonts from Google, which is why the site still looked right. Nobody noticed the broken ones because nothing on screen depended on them.
Two Fixes That Removed Them
Fix one: delete the leftover fonts. We removed all three families from the Font Library until it showed No fonts installed.
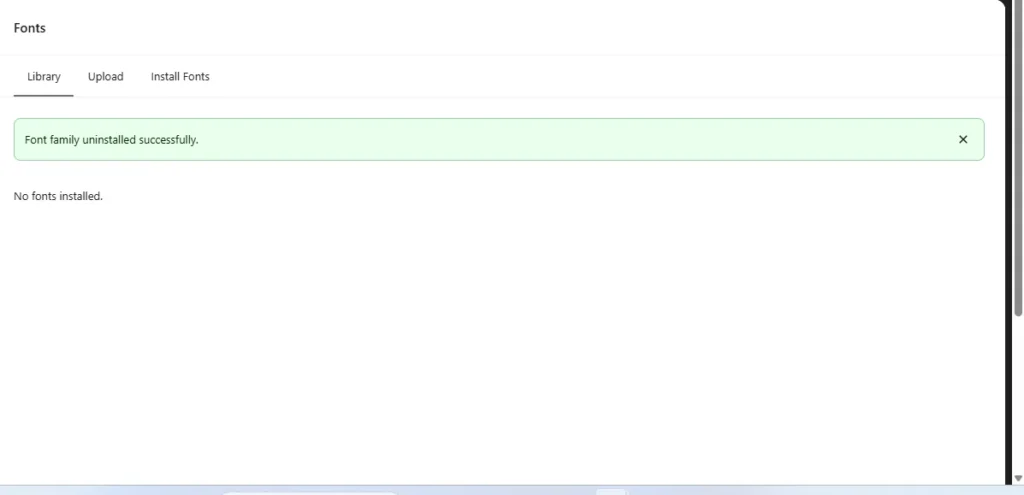
Then we reloaded the post with the cache disabled. All six 404 errors were still there.
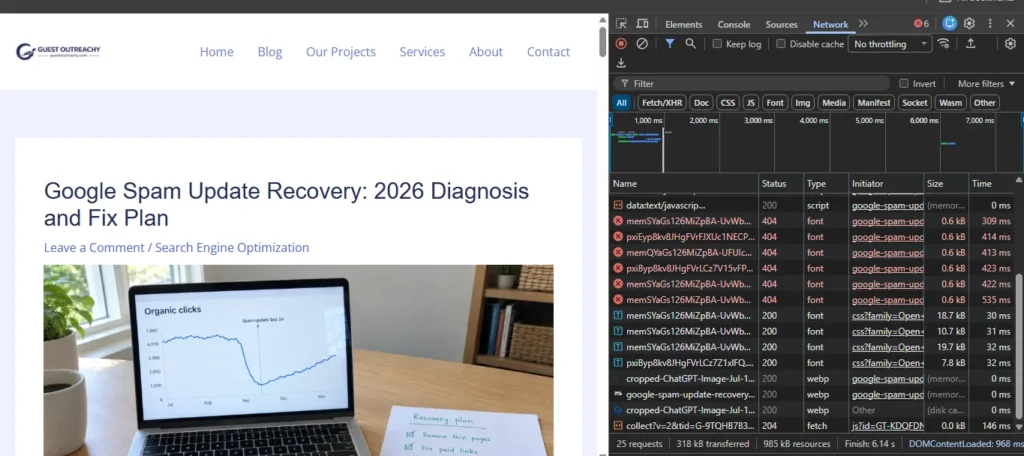
This is the part most guides skip. Deleting the fonts was not enough, because WordPress itself prints font rules into the page on every load. The files were gone, but the instructions to fetch them were not.
Fix two: stop WordPress from printing them. We installed WPCode, a free plugin for small code snippets, and added a PHP snippet called Remove broken local fonts:
remove_action( 'wp_head', 'wp_print_font_faces', 50 );
remove_action( 'wp_head', 'wp_print_font_faces_from_style_variations', 50 );
We set it to Auto Insert and Run Everywhere, switched it to Active and saved.
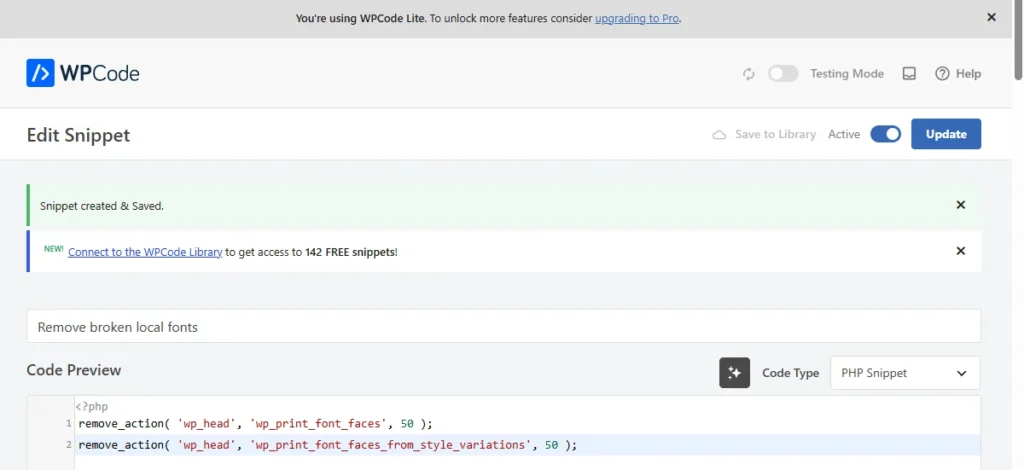
One warning before you copy this: only use it if your theme loads fonts some other way, as Astra does. If your theme relies on the Font Library, this snippet will remove fonts you need.
We purged the cache, opened the post again and checked the page source with Ctrl + U. The uploads/fonts rules were gone.
Cleaning Up LiteSpeed Cache
That left guest.vary.php and a few other things we spotted on the LiteSpeed Cache dashboard:
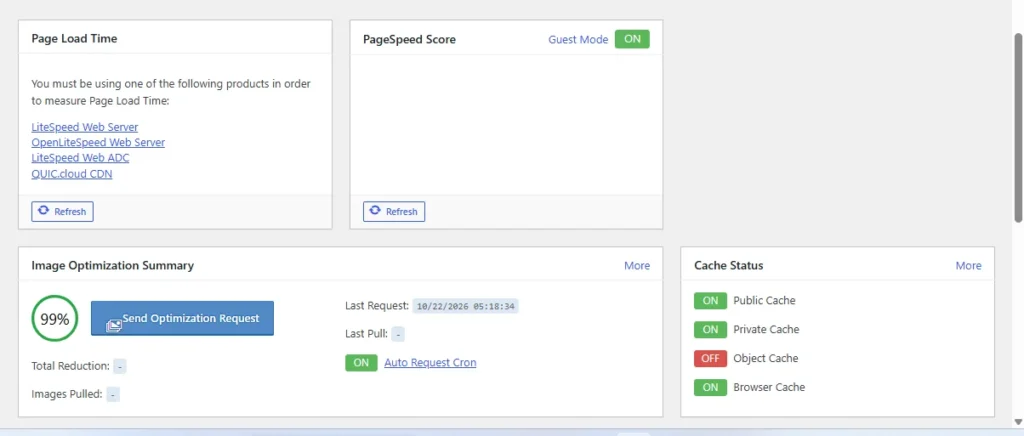
Guest Mode. This LiteSpeed feature serves a cached page to first time visitors, then calls guest.vary.php in the background. On our server that call was refused with a 403 every time, and Googlebot kept trying it. We turned Guest Mode off, and the request disappeared from the Network panel.
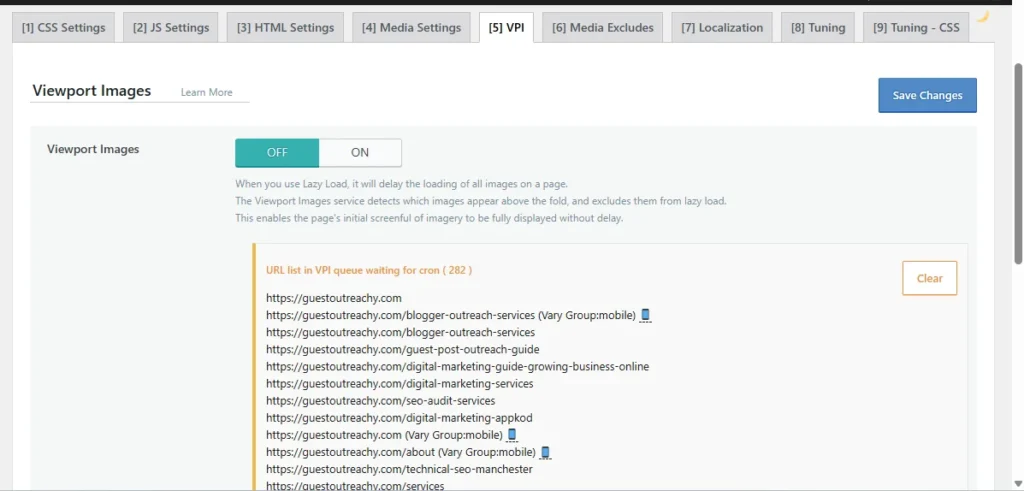
The VPI queue. Viewport Images had 282 URLs waiting in a queue, even though the feature was already switched off. They were never going to be processed, so we cleared the queue.
Object Cache. This one targets the slow server response. Object cache keeps the answers to common database questions in memory, so WordPress does not have to ask the database the same thing on every visit. We turned it on in two places: first in Hostinger hPanel, then in LiteSpeed Cache under the Object tab, with Memcached as the method. The first connection test failed. After the Hostinger side was switched on, it passed:
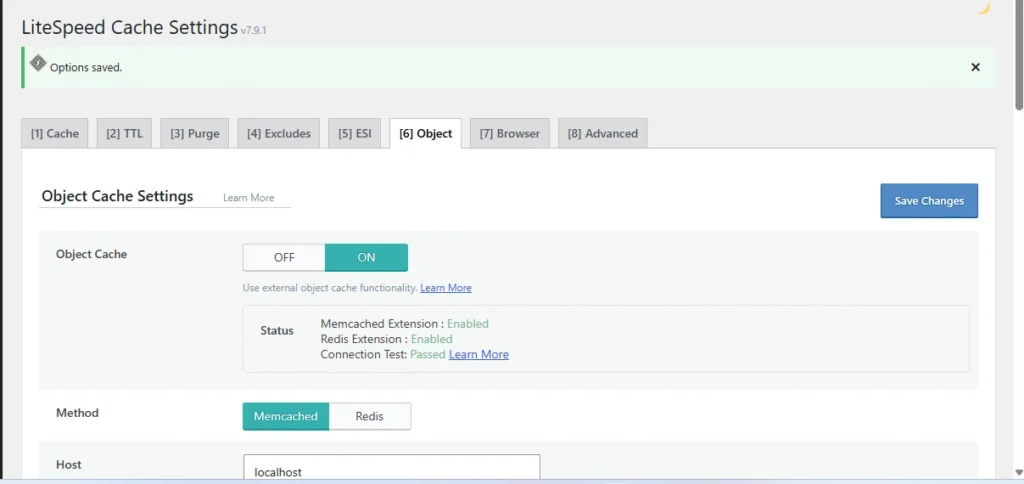
The QUIC.cloud CDN was already on, so that needed no change.
Before and After Numbers
Here is the same blog post, loaded the same way, before and after the work:
| Measure | Before | After |
|---|---|---|
| Requests | 25 | 19 |
| Failed requests | 7 (six fonts at 404, one file at 403) | 0 |
| Data transferred | 330 kB | 313 kB |
| DOMContentLoaded | 783 ms | 797 ms |
| Console | Red errors | No issues |
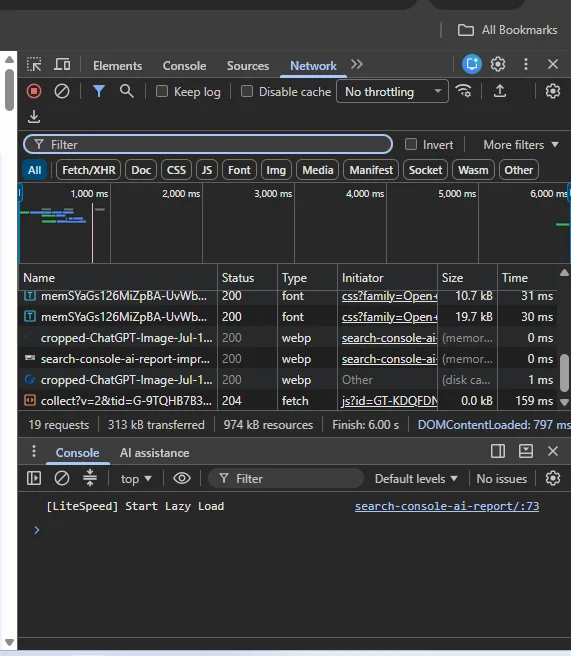
We want to be straight about what this shows. The page did not suddenly become faster for visitors. DOMContentLoaded stayed under one second both times. What changed is that every request now succeeds, the Console is clean and Googlebot has no broken file left to keep retrying.
The server speed change from object cache will show up in Search Console, not in this table. Crawl stats take a while to fill with new data, so we will add the new Search Console results to this post once two full weeks have passed.
Why This Matters for Rankings
A few broken font requests will not get a site penalized. Google treats a 404 as a file that does not exist, and it says 4XX errors, apart from 429, do not slow its crawling down. So why bother?
Wasted requests. On our site, 11 percent of Googlebot requests went to a file that should never have been crawled. Every one of those was a request not spent on a real page.
Noise that hides real problems. When the error report is full of the same harmless file, a real broken page is easy to miss. A clean report makes the next real problem stand out.
Best practice checks. Before the fix, the PageSpeed Insights report flagged that browser errors were logged to the Console. That is a small mark against the page, and it is gone now.
Server speed. Google crawls more comfortably when a server answers quickly, and visitors notice slow first responses too. That is why the object cache step matters more than any single font fix.
In short, this kind of cleanup does not launch a site to the top of the results. It removes friction, so your content gets judged on its own merit.
Run Your Own Check
You can repeat everything above in about fifteen minutes:
- Open a post, press Ctrl + Shift + I and go to the Network tab
- Tick Disable cache and reload
- Filter with
status-code:404, then 403 and 500 - Click each failed row and check its Initiator
- Press Ctrl + U and search the source for the broken path
- Fix the cause, purge your cache and reload to confirm
- Look at Search Console crawl stats again in two weeks
We now run this after every theme change, plugin update and site move. It has become part of the monthly routine we follow for our own site and for client sites.
FAQ
What is Ctrl Shift I in Chrome?
It opens Chrome DevTools on Windows and Linux. On a Mac, use Command + Option + I.
How do I show only 404 errors in the Network tab?
Type status-code:404 in the Filter box, tick Disable cache and reload the page.
Why does F12 not open DevTools on my laptop?
On many laptops F12 is a brightness or volume key. Press Fn + F12, or use Ctrl + Shift + I.
Do 404 errors on fonts hurt SEO?
Not directly. Google does not penalize a page for a missing font file. But they waste crawl requests, clutter your reports and can change how a page looks if the font is needed.
Why did deleting fonts not fix the 404 errors?
WordPress can keep printing font rules into the page after the files are gone. In our case, a small WPCode snippet that stops those rules finished the job.
Conclusion
To find 404 errors in Chrome DevTools, open the Network tab, disable the cache, reload and look for red rows. The Initiator tab and the page source then show you where each broken request comes from.
On our own site, that one check uncovered six missing fonts, a refused plugin file that Googlebot hit almost daily and a server that needed object cache. None of it showed on screen.
This is the same audit we run on every client site before we start work.
Take fifteen minutes and run the same check on your site this week. If it turns up a mess you would rather hand over, the Guest Outreachy team is happy to help.